Quick Answer: What Does a Billboard Actually Cost in 2026?
A standard outdoor billboard rental costs between 250and14,000 per 4-week cycle for static formats, and 1,200to15,000 for digital LED billboards. Premium placements like Times Square can exceed 100,000/month.Thenationalaverageacrossallformatssitsatroughly3,953 per 4-week cycle.
After personally auditing dozens of OOH campaigns for clients across retail, F&B, and entertainment sectors, I’ve found that most small-to-mid businesses get the best cost-per-impression value from digital billboards in mid-tier markets — not the marquee locations that dominate the conversation.
Here’s the fast-reference pricing table before we go deeper:
| Billboard Type | Monthly Cost Range | Best For |
|---|---|---|
| Static (rural/low-demand) | 200–500 | Local awareness, long-term branding |
| Static (mid-size market) | 500–4,000 | Regional campaigns |
| Digital LED (standard) | 1,200–15,000 | Rotating promotions, event-driven ads |
| Digital LED (major metro) | 15,000–50,000+ | National brand launches |
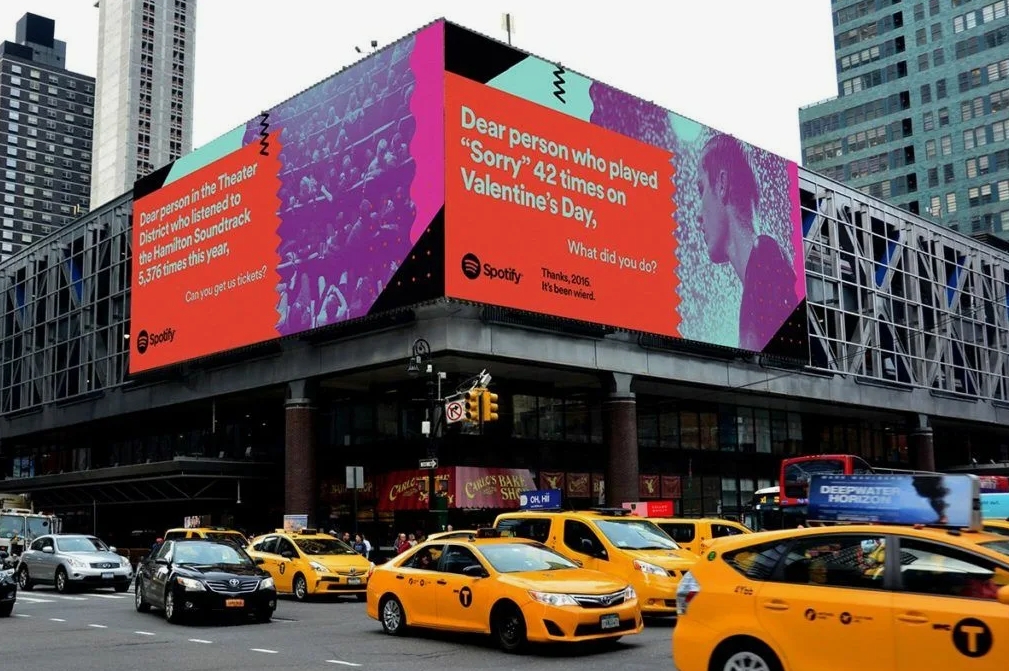
| Times Square / marquee | 50,000–100,000+ | High-impact brand moments |
| Pay-per-play (programmatic) | From $0.15/play | Flexible, data-driven campaigns |
Global LED Billboard Market: 2026 Data Snapshot
The LED billboard market is no longer a niche segment — it’s a core pillar of the global advertising ecosystem.
According to Business Research Insights (updated May 2026), the global LED billboard market is valued at USD 5.55 billion in 2026 and is projected to reach USD 10.63 billion by 2035, growing at a CAGR of 7.5%. This is a significant correction from older projections that cited an $18 billion figure by 2027 — the actual trajectory is more measured but still robust.
Regional Breakdown
| Region | Growth Driver | Market Position |
|---|---|---|
| Asia-Pacific | Rapid urbanization, infrastructure investment (China, India, South Korea) | Leading growth region |
| North America | Programmatic DOOH adoption, premium inventory demand | Highest revenue per unit |
| Europe | Smart city initiatives, sustainability-driven LED upgrades | Steady, regulation-influenced growth |
| Latin America / MEA | Emerging urban corridors, local brand expansion | Early-stage, high upside |
Key 2026 Market Trends
- Full-color LED is the fastest-growing segment — advertisers are moving away from single and dual-color displays toward full HD video-capable screens
- Remote content management is now standard — real-time scheduling and message delivery without physical intervention
- Energy efficiency improvements are reducing operational costs, making LED more accessible to SMBs
- Regulatory pressure on light pollution and visual clutter is tightening in major European and North American cities — a factor that limits supply and keeps premium inventory prices elevated
Types of Outdoor Street Billboards
Not all billboards are created equal. Choosing the wrong format is one of the most common — and costly — mistakes I see advertisers make.
Comparison by Format
| Format | Typical Size | Best Location | Avg. Monthly Cost | Key Advantage |
|---|---|---|---|---|
| Large LED Display | 14×48 ft and above | City squares, highway junctions, shopping mall facades | 5,000–50,000+ | Maximum visual impact, video-capable |
| Digital LED Billboard (mid-size) | 10×20 ft to 12×24 ft | Commercial streets, transit corridors | 1,200–15,000 | Flexible content rotation, dayparting |
| LED Advertising Light Box | 4×6 ft to 6×12 ft | Bus stops, subway stations, street-level retail | 300–2,500 | High dwell time, pedestrian-level engagement |
| LED Dot Matrix Display | Variable | Traffic management, public information boards | 200–1,500 | Low energy, real-time data display |
| Static Printed Billboard | 14×48 ft (standard) | Highways, rural routes | 250–4,000 | Lowest cost, longest longevity |
Which Format Should You Choose?
- Brand awareness at scale → Large LED display in a high-footfall commercial district
- Promotional campaigns with changing offers → Digital LED billboard with content rotation
- Hyperlocal targeting (commuters, pedestrians) → LED light box at transit points
- Budget-constrained, long-term presence → Static billboard in a well-trafficked corridor
Outdoor Street Billboard Pricing Breakdown
Pricing is driven by five core variables. Understanding each one lets you negotiate more effectively and avoid overpaying.
The Five Pricing Factors
1. Location Tier This is the single biggest cost driver — analogous to real estate. A billboard in downtown Los Angeles can cost 20x more than an equivalent unit in rural Arkansas.
2. Traffic Volume & Impressions Billboard operators use CPM (cost per thousand impressions) as a baseline metric. Standard billboard CPM ranges from 6to10; premium marquee locations run 15to25.
3. Format (Static vs. Digital) Digital billboards command a 3–5x premium over static, but they allow multiple advertisers to share the same screen through rotation — which is why operators can charge more while individual advertisers pay for time slots rather than exclusive placement.
4. Rental Duration Longer commitments typically unlock 10–20% discounts. Most operators price in 4-week cycles; some digital platforms now offer hourly or per-play pricing.
5. Production & Installation Costs Often overlooked in initial budgeting:
- Static billboard printing: 500–2,000 per creative
- Digital content production: 1,000–5,000 depending on animation complexity
- Installation/posting fees: 200–800 (static); typically included for digital
Pricing by Market Tier
| Market Type | Static (4-week) | Digital LED (4-week) | Notes |
|---|---|---|---|
| Rural / low-demand | 200–800 | 500–2,000 | Limited inventory, long-term deals available |
| Mid-size city | 800–4,000 | 2,000–8,000 | Best value-to-reach ratio |
| Major metro (standard) | 2,000–10,000 | 5,000–20,000 | High competition for premium spots |
| Premium downtown/highway | 5,000–20,000 | 10,000–50,000 | Requires advance booking |
| Times Square / marquee | 20,000–50,000 | 50,000–100,000+ | Brand statement, not performance play |
Annual Maintenance Costs (LED Billboards)
- Standard LED billboard: 2,000–5,000/year
- High-use or harsh-environment installations: 5,000–12,000/year
- Preventive maintenance contracts typically reduce emergency repair costs by 30–40%
Digital vs. Traditional Billboard: ROI Comparison
This is the question I get asked most often by clients evaluating their OOH budget allocation. The data from Worldmetrics’ 2026 verified statistics report gives us a clear picture.
Head-to-Head Performance Data
| Metric | Digital LED Billboard | Static Billboard |
|---|---|---|
| Brand awareness boost vs. baseline | +41% | Baseline |
| Engagement rate advantage | +35% | Baseline |
| Brand recall after 1 month | 78% | ~54% |
| Brand recall after 2 months | 60% | 35% |
| Nighttime performance vs. daytime | +37% (LED advantage) | Minimal difference |
| Average viewer attention time | 8.2 seconds | 6.1 seconds (active) |
| Cost efficiency (longevity) | Lower (content rotates) | Higher (static persists) |
| Flexibility for promotions | High (real-time updates) | Low (reprint required) |
Overall Effectiveness Benchmarks (All Billboard Formats, 2026)
- 92% brand recall rate among consumers aged 18–45
- 30–42% of viewers report a billboard directly influenced a purchase decision
- 68% of consumers who recall a billboard visit the brand’s website within 1 month
- 71% feel more motivated to visit a brand’s physical location after billboard exposure
- Interactive/QR-enabled billboards drive 62% more engagement than passive formats
My take: For campaigns with a single, stable message running 3+ months, static billboards often deliver better cost-per-recall. For promotional campaigns, seasonal offers, or anything requiring content flexibility, digital LED is worth the premium.

Who Should Advertise on Billboards?
Billboard advertising works across virtually every industry, but the ROI profile varies significantly by sector.
Industry Suitability Matrix
| Industry | Billboard ROI Potential | Best Use Case | Key Stat |
|---|---|---|---|
| Retail | High | Discount promotions, new store openings | Billboards with price tags convert 23% better |
| Food & Beverage | High | Menu highlights, limited-time offers | Restaurant billboards near residential areas boost takeout orders by 31% |
| Automotive | Very High | Dealership awareness, test drive CTAs | Automotive billboards near dealerships boost test drive requests by 54% |
| Entertainment | High | Event promotion, movie/concert launches | Strong recall for time-sensitive campaigns |
| Tourism & Hospitality | High | Destination awareness, booking CTAs | Tourism billboards increase hotel bookings by 36% |
| Local Services | Medium-High | Plumbers, dentists, law firms | Local service businesses see 45% increase in inquiries |
| B2B / Enterprise | Low-Medium | Brand credibility, not direct response | Better suited for airport/transit placements |
Minimum Viable Budget by Business Size
- Small business (local awareness): 500–2,500/month on 1–2 static or digital units in a targeted corridor
- Mid-size brand (regional campaign): 5,000–15,000/month across 5–10 digital units
- National brand (multi-market): $50,000+/month with programmatic DOOH for audience targeting
How to Choose a Billboard Location
Location selection is where most advertisers leave money on the table. Here’s the framework I use when evaluating placements for clients.
The 5-Factor Location Scoring Model
1. Traffic Volume (Impressions) Request verified traffic count data from the operator — not estimated impressions. For highway placements, AADT (Annual Average Daily Traffic) data from state DOTs is publicly available and more reliable than operator-provided figures.
2. Audience Alignment Match the placement to where your target customer actually travels:
- Younger demographics (18–34): Near universities, entertainment districts, transit hubs
- Families: Near schools, suburban retail corridors, family entertainment venues
- Business decision-makers: Airport terminals, downtown financial districts, business park corridors
3. Sightline Quality A billboard with 50,000 daily impressions but poor sightlines (obstructed by trees, facing away from traffic flow, or positioned at a curve where drivers can’t read it) will underperform a 20,000-impression unit with a clean, unobstructed view.
4. Competitive Density Avoid clusters where 3+ competitor billboards are visible simultaneously. Visual clutter dilutes recall. I’ve seen campaigns in Times Square-adjacent locations underperform mid-city placements purely because of saturation.
5. Regulatory Environment Check local zoning ordinances before committing. Several major U.S. cities and European municipalities have enacted restrictions on new digital billboard permits, and some existing permits are subject to renewal risk.
Location Reach Benchmarks
| Location Type | Estimated Daily Reach |
|---|---|
| Urban billboard (major city) | 85% of city residents |
| Highway billboard (10-mile stretch) | 78% of drivers |
| Shopping district (peak hours) | 92% of shoppers |
| College campus | 95% of students monthly |
| Digital billboard (major city) | 6 million+ people weekly |
Programmatic DOOH: The 2026 Buying Revolution
This is the most significant shift in outdoor advertising since the transition from painted walls to printed vinyl — and most advertisers are still not taking advantage of it.
Programmatic DOOH (pDOOH) allows you to buy billboard impressions in real time, targeting by audience signals, time of day, weather conditions, and location data — the same way you’d run a Google Display campaign, but on physical screens.
How It Works
- Inventory is aggregated across thousands of digital screens on platforms like Blindspot (2.5M+ screens across 50+ countries), Vistar Media, and Place Exchange
- Campaigns can be activated, paused, or adjusted in real time — no reprinting, no operator calls
- Pricing models include CPM, pay-per-play (from $0.15/play), and dayparted packages
pDOOH vs. Traditional Buying
| Factor | Traditional OOH Buying | Programmatic DOOH |
|---|---|---|
| Minimum commitment | 4-week cycle | Hourly / per-play |
| Targeting capability | Location only | Location + audience + context |
| Content flexibility | Low (reprint required) | Real-time updates |
| Measurement | Estimated impressions | Verified plays + attribution |
| Minimum budget | 500–1,200/month | $500 test campaigns available |
| Best for | Long-term brand presence | Performance-driven, flexible campaigns |
Recommended Starter Budgets for pDOOH
- Test campaign: $500 (validate creative and location performance)
- First real campaign: $2,500 (multi-location, 2–4 week run)
- Scale phase: $5,000+ (multi-city, audience-segmented)
Frequently Asked Questions
Q: How much does a billboard cost per month in 2026?
A: The range is wide: 200/monthforaruralstaticboardto100,000+/month for a Times Square digital placement. The national average across all formats is approximately 3,953per4−weekcycle.Mostsmallbusinessesfindtheirsweetspotbetween500 and $5,000/month.
Q: Are digital LED billboards worth the higher cost?
A: For most advertisers, yes — digital billboards deliver 41% higher brand awareness and 35% better engagement than static formats. The key caveat: if your message is stable and your campaign runs 3+ months, static boards often deliver better cost-per-recall due to their longevity advantage.
Q: What is the lifespan of an LED billboard?
A: A well-maintained LED billboard typically lasts 10–15 years. Lifespan depends heavily on operating environment (coastal humidity and extreme temperature swings accelerate degradation) and maintenance frequency. Annual preventive maintenance contracts typically cost 2,000–5,000 and significantly extend operational life.
Q: How do I measure billboard advertising ROI?
A: The most reliable methods in 2026 are: (1) mobile device location data — measuring how many people who passed your billboard later visited your store or website; (2) unique URL or QR code tracking on the creative; (3) brand lift surveys comparing awareness among exposed vs. unexposed audiences. Programmatic DOOH platforms provide verified play counts and some attribution data natively.
Q: What’s the minimum budget to start with billboard advertising?
A: For traditional static billboards, 500–800/month in a mid-size market is a realistic entry point. For programmatic DOOH, test campaigns start at $500. I’d recommend a minimum 8-week commitment to gather meaningful performance data.
Q: How far in advance should I book a billboard?
A: For standard inventory in mid-size markets, 2–4 weeks is usually sufficient. For premium placements in major metros, especially around holidays, sporting events, or product launch windows, book 3–6 months in advance. Times Square and comparable marquee locations often require 6–12 months lead time.
Q: Are there restrictions on what I can advertise on a billboard?
A: Yes. Most jurisdictions prohibit tobacco advertising on outdoor billboards. Alcohol advertising is permitted in most U.S. states but subject to placement restrictions near schools and places of worship. Cannabis advertising regulations vary significantly by state. Always verify local ordinances before finalizing creative.
Conclusion
Outdoor street billboard advertising in 2026 is more accessible, more measurable, and more flexible than it’s ever been — but the fundamentals haven’t changed. Location quality, audience alignment, and creative clarity still determine whether a campaign succeeds or disappears into the visual noise.
The LED billboard market’s growth to USD 5.55 billion in 2026 reflects genuine advertiser demand, not hype. The emergence of programmatic DOOH is the most important structural shift for buyers: it removes the minimum commitment barrier and brings real-time targeting to physical media for the first time.
For most advertisers, the practical starting point is a digital LED unit in a mid-tier market at 1,200–5,000/month, with a QR code or unique URL to track attribution. Scale from there based on data, not assumptions.