Quick reference: Pixel pitch selection by deployment environment
| Pixel Pitch | Minimum Viewing Distance | Primary B2B Use Case | Relative Cost Index |
| P1.2 | 1.2 m (4 ft) | Broadcast studio, simulation, command center |
$ |
| P1.5 | 1.5 m (5 ft) | Control room, premium boardroom, virtual production |
|
| P1.8 | 1.8 m (6 ft) | Corporate lobby, high-end retail, NOC | $$$ |
| P2.0 | 2.0 m (6.5 ft) | Conference room, museum, hospitality | $$$ |
| P2.5 | 2.5 m (8 ft) | Event staging, DOOH, large-format lobby | $$ |
Cost index is relative to a P2.5 SMD baseline at equivalent cabinet size.
If you are reading this as a system integrator, you have almost certainly been through a version of this scenario: a client wants a fine pitch LED video wall, you spec a P1.5 for their boardroom, procurement pushes back on price, and the conversation stalls. Or worse—a competitor wins the bid with a P2.5 that looks soft at the three-meter conference table, and now your client associates “LED” with disappointment. Neither outcome is acceptable, and both are entirely avoidable with the right specification framework.
This guide is built for AV integrators, DOOH operators, and B2B project managers who need more than a definition. Based on our experience evaluating and deploying indoor LED video wall solutions across corporate, broadcast, and public-space environments, the single most expensive mistake in fine pitch procurement is not overspending—it is mismatching pixel density to actual viewing conditions and content type. The sections below will give you the decision tools, technical benchmarks, and supplier evaluation criteria to eliminate that risk.
What Is a Fine Pitch LED Display? The Definition B2B Buyers Actually Need
The industry definition is clean: a fine pitch LED display is any direct-view LED (dvLED) panel with a pixel pitch—the center-to-center distance between adjacent pixels, measured in millimeters—of P2.5 or below. But that definition alone answers almost nothing useful for a procurement decision.
What actually matters is the relationship between pixel pitch, pixel density, and perceived image quality at a given viewing distance. At P1.5, you are packing approximately 444,000 pixels per square meter. Drop to P2.5, and that figure falls to roughly 160,000. The same 4K content resolves differently—fundamentally differently—depending on where your audience is standing.
How the P-Value Defines Everything From Resolution to ROI
The “P” in P1.2 or P2.5 is not a marketing tier. It is a physical measurement, and it governs three interconnected variables that define the business case for any indoor LED installation:
Resolution per cabinet area
A P1.5 cabinet at 640×480 mm delivers 4× the pixel count of the same cabinet at P3.0. For data-intensive content—financial dashboards, situational awareness maps, broadcast graphics—this is the difference between a display that serves its purpose and one that merely fills a wall.
Minimum comfortable viewing distance
The widely cited rule of thumb—1 mm of pitch per 1 meter of viewing distance—is a floor, not a target. Based on practical calibration data from control room deployments, we recommend a conservative ratio of 1 mm pitch per 1.2–1.5 meters for text-heavy content. A P1.8 display in a room where the closest seat is 2.5 meters away is a sound specification. That same P1.8 in a 6-meter boardroom is unnecessary budget spend.
Total cost of ownership
This is where integrators must set client expectations early. A P1.2 wall costs approximately 40–55% more per square meter than a comparable P2.5 installation, and that premium scales with project size. The component density required at sub-1.5mm pitches demands tighter manufacturing tolerances, more expensive driver ICs, and more sophisticated thermal management—all of which translate directly into hardware line items and longer-term maintenance complexity.
Fine Pitch vs. Standard Pitch vs. Ultra-Fine Pitch
The market uses these terms inconsistently. For practical B2B procurement purposes, the segmentation that matters is:
-
Ultra-fine pitch (P0.9 and below): Emerging COB territory. Viable for premium broadcast and simulation environments. Still commands a significant cost premium and requires specialist commissioning.
-
Fine pitch (P1.0–P2.5): The primary commercial segment. This guide’s focus. Covers the overwhelming majority of corporate, DOOH, and AV integration projects.
-
Standard pitch (P3.0 and above): Suitable for large-format environments with viewing distances exceeding 4–5 meters. Generally not appropriate for close-viewing indoor video wall applications.
dvLED vs. LCD Video Wall vs. Projection: Why Fine Pitch LED Wins for Indoor Installs
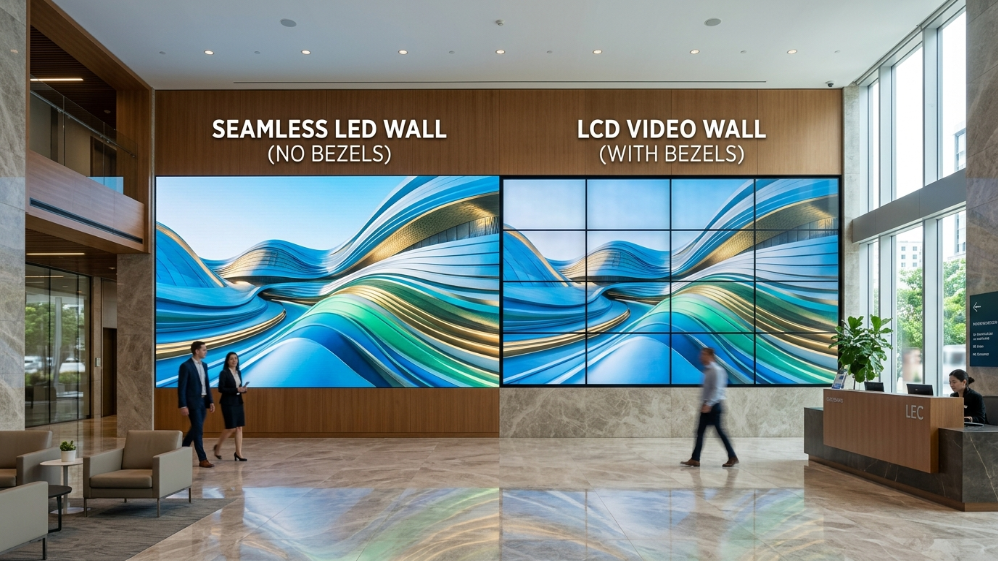
LCD video walls have not kept pace. The bezels—even in narrow-bezel configurations—remain a visual fault line that becomes acute in data visualization and broadcast applications. Projectors introduce ambient light sensitivity and geometric calibration overhead that is simply incompatible with enterprise-grade reliability requirements.
Fine pitch LED wins on four commercially decisive dimensions: seamless tiling with no bezels, sustained brightness up to 1,500 nits for challenging ambient light environments, 100,000-hour rated lifespan reducing refresh cycle costs, and true modular serviceability—front-accessible panels mean a single LED module failure does not require screen downtime. For any indoor environment where the display is on for six or more hours per day, the TCO math consistently favors dvLED over LCD tiling within a three-to-five year window.
The P1.2 to P2.5 Decision Matrix: Matching Pixel Pitch to Your Project
No single pixel pitch is right for every project. The correct specification is a function of four variables working together: viewing distance, screen physical size, content type, and project budget. Integrators who lead with pitch selection—rather than leading with these four variables—are building from the wrong end.
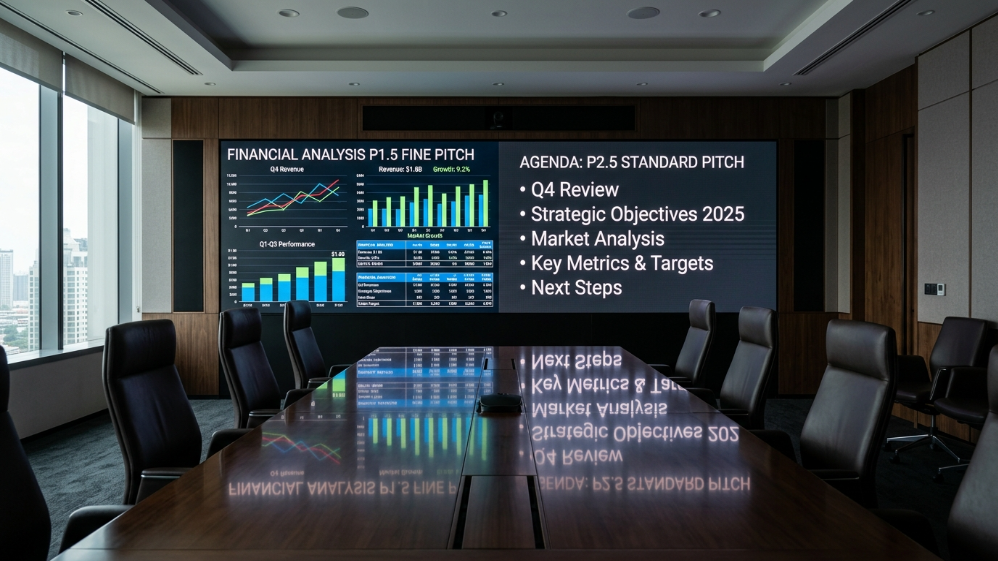
P1.2–P1.5: When Ultra-Fine Pitch Delivers Real ROI
At P1.2 and P1.5, you are specifying for environments where the audience is close, the content is detail-critical, and visual fatigue is a real operational concern. Control rooms running 24/7 situational awareness feeds. Broadcast studios where the wall appears on camera and must resolve cleanly at any shutter angle. Financial trading floors where multiple data streams must be legible simultaneously from 1.5–2 meters.
The commercial case here is not simply image quality—it is risk mitigation. In a military command center or network operations center (NOC), a display that pixelates or loses coherence under peak data load is not a cosmetic problem. It is an operational liability. P1.2–P1.5 with COB packaging and a calibrated Delta E of ≤1 is the specification that eliminates that liability.
P1.8–P2.0: The Sweet Spot for Corporate Boardrooms and High-End Retail
This is where the most B2B volume lives, and where the most specification errors happen. A P1.9 fine pitch LED video wall in a 60 m² boardroom with seating at 2.5–4.5 meters is visually indistinguishable from a P1.5 in the same room—but arrives at a 20–30% lower hardware cost. That is a margin the integrator can return to the client as value, or protect as project profitability.
High-end retail is a different demand profile. Brightness management becomes more important than pixel density—typical ambient light in a premium retail environment can reach 1,200 lux, requiring sustained display brightness of 800–1,000 nits without thermal throttling. At P1.8–P2.0 with a quality SMD black-face LED, contrast ratio in high-ambient environments is measurably superior to P1.5 panels from lower-tier manufacturers running at maximum drive current to compensate.
P2.5: The B2B Value Play for Event Staging and DOOH
The P2.5 decision matrix for B2B segment deployment:
| Deployment Scenario | Screen Size | Audience Distance | Recommended Pitch | Key Spec Priority |
| Corporate event stage | 8×4.5 m | 5–20 m | P2.5–P3.9 | Brightness, refresh rate |
| DOOH retail atrium | 4×2.5 m | 3–8 m | P2.5 | Contrast ratio, uniformity |
| Hotel lobby focal wall | 6×3.5 m | 4–12 m | P2.5–P3.0 | Color accuracy, slim profile |
| Trade show brand wall | 5×3 m (rental) | 2–6 m | P2.5 | Portability, lock mechanism |
| Museum/cultural institution | 3×2 m | 2–5 m | P1.8–P2.5 | Color depth, silent operation |
| Airport wayfinding display | 2×1.5 m | 3–8 m | P2.5 | High brightness, 24/7 reliability |
P2.5 does not mean compromise—it means precision fit for the environment. A well-engineered P2.5 SMD panel with a 3,840 Hz refresh rate, 1,200-nit peak brightness, and factory-calibrated color uniformity will outperform an under-spec’d P1.5 from a second-tier supplier on every metric that matters to an event production company: image stability on camera, fast rigging, and zero single-point failure during a live show.
The Minimum Viewing Distance Formula Every Integrator Must Know
The industry-standard formula—minimum viewing distance (meters) = pixel pitch (mm) × 1—is a starting point, not a specification tool. For B2B project documentation, apply this tiered model instead:
-
Minimum distance (no pixelation perceptible): P-value × 1.0 m
-
Optimal distance (full resolution advantage): P-value × 1.5 m
-
Distance of diminishing returns (P1.5 and P2.5 become perceptually equivalent): P-value × 4.0 m
Above that third threshold, specifying P1.5 over P2.5 is a cost decision with no visual dividend. Every dollar spent on tighter pitch beyond that ratio would be better allocated to a higher-quality signal processing chain or a more capable video controller—investments that affect image quality at every viewing distance, not just close range.
COB vs. SMD vs. GOB Packaging: Which Technology Should Your Next Project Specify?
Pixel pitch tells you how dense the display is. Packaging technology tells you how robust, how accurate, and how serviceable it will be over a five-year operational cycle. These are not equivalent considerations—and conflating them is one of the most consistent specification gaps we see in B2B RFPs.
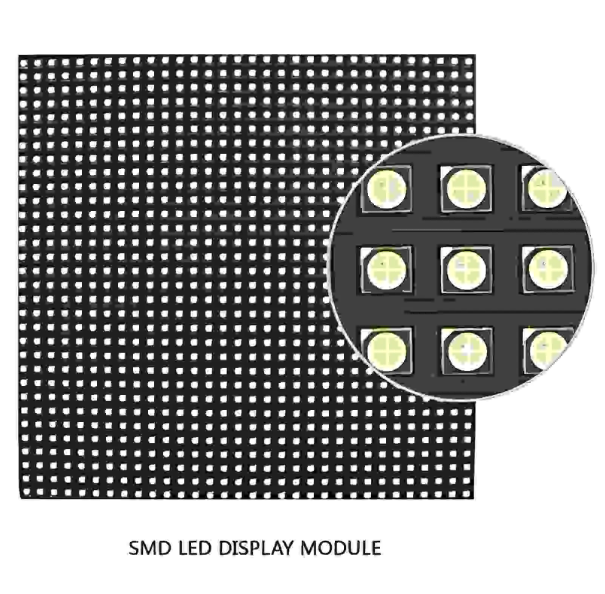
SMD (Surface-Mount Device) remains the dominant technology for the P1.5–P2.5 segment. Individual red, green, and blue LED chips are mounted separately onto a PCB, which gives manufacturers flexibility in binning and replacement. SMD black-face variants—where the LED housing is dark rather than white—deliver meaningfully better contrast ratios in high-ambient environments. For most corporate and DOOH installations, a quality SMD panel from a Tier 1 or established Tier 2 manufacturer remains the rational default.
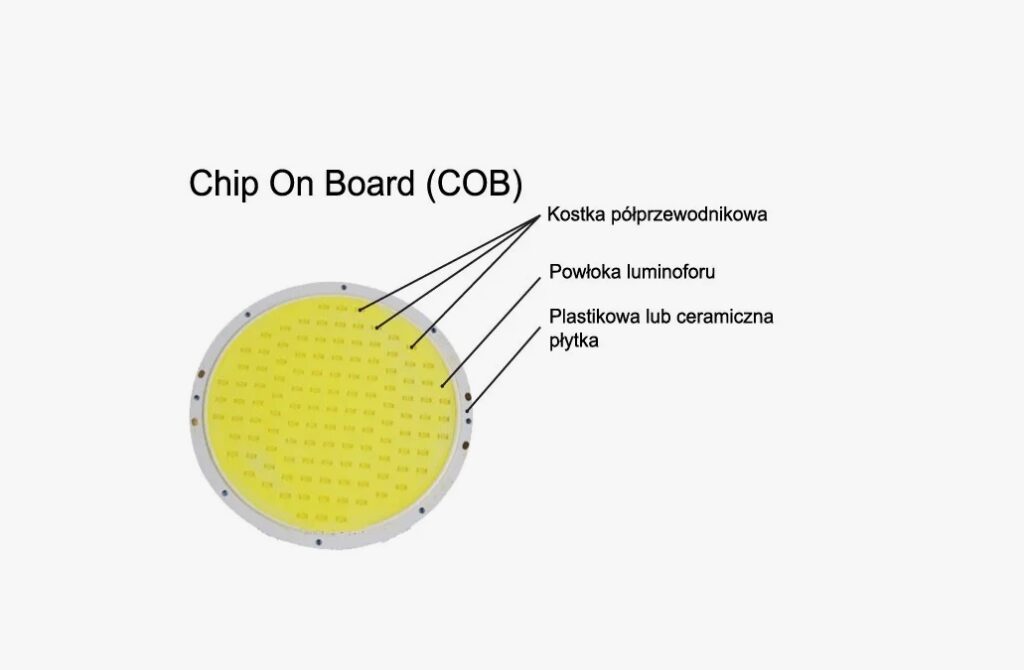
COB (Chip-on-Board) is the technology to specify below P1.5, and increasingly at P1.5–P1.8 for high-abuse environments. Multiple LED chips are bonded directly to the substrate and encapsulated in a single resin layer—eliminating the individual housing that makes SMD panels vulnerable to chip-level damage. The commercial impact is significant: COB panels demonstrate 30–40% greater impact resistance than SMD equivalents, with substantially better moisture and dust ingress performance. Based on deployment data from control room installations, COB displays also show superior long-term color stability, with Delta E drift measurably lower over 20,000+ operating hours.
The tradeoff is repairability. SMD allows individual chip replacement; COB module replacement requires swapping a larger board section. Factor this into your maintenance SLA conversations with clients who prioritize lowest-possible repair cost over reliability.
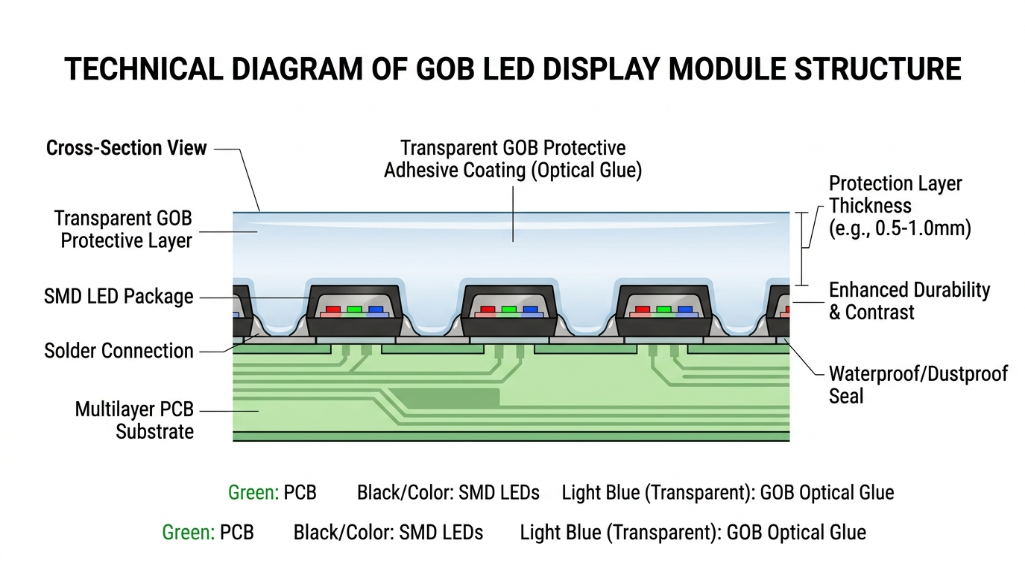
GOB (Glue-on-Board) applies a protective epoxy coating over a conventional SMD layout. It improves physical protection relative to bare SMD at a lower cost premium than COB, but it does not match COB’s thermal dissipation or long-term color performance. GOB is a reasonable specification for rental LED environments where panel-to-panel impact during transit is the primary reliability risk.
Key Performance Specs: What to Put in Your Client’s RFP
Pixel pitch and packaging select your hardware category. These four specifications define whether the hardware inside that category will actually perform.
| Specification | Minimum Acceptable | B2B Best Practice | Why It Matters Commercially |
| Refresh Rate | 1,920 Hz | 3,840 Hz+ | Eliminates flicker in broadcast/camera capture; reduces viewer fatigue in 8h+ environments |
| Brightness (Peak) | 600 nits | 800–1,200 nits (indoor) | Sustains visibility under retail and office ambient lighting without thermal throttling |
| Contrast Ratio | 3,000:1 | 5,000:1–10,000:1 | Defines perceived depth and color separation—critical for data visualization and brand content |
| Color Accuracy (Delta E) | ΔE ≤ 3 | ΔE ≤ 1 | Below ΔE 1, color error is imperceptible; essential for broadcast, medical, and luxury retail |
| Grayscale Depth | 12-bit | 14–16-bit | Higher bit depth preserves shadow detail and smooth gradients in dark content |
| Viewing Angle | 120° | 160°+ | Ensures consistent image quality across wide seating configurations in boardrooms and lobbies |

Refresh rate deserves specific attention for broadcast and camera-facing deployments. A 1,920 Hz display will produce visible scan lines or a rolling band effect when filmed with a camera operating at common shutter speeds—1/50s, 1/100s, 1/250s. At 3,840 Hz, that artifact disappears entirely. If your client is a broadcast studio, a live event production company, or any environment where the wall appears on camera, 3,840 Hz is a non-negotiable line item in your specification, not a premium upsell.
The Signal Processing Ecosystem: Beyond the Panel Itself
A P1.5 COB panel with a 3,840 Hz refresh rate will perform like a P2.5 SMD if the signal chain feeding it is mismatched. This section is where integrators differentiate themselves from resellers.
The chain has three critical links: sending card → receiving card → LED module. The sending card (installed in the control PC or server) compresses and transmits image data. The receiving card, mounted on each cabinet, decodes and distributes pixel data to the LED modules. Every link in this chain has latency and resolution ceiling implications.
-
NovaStar dominates the professional segment, and for good reason. The NovaStar MCTRL4K processes up to 8K×2K loading capacity with hardware-level color calibration integration through NovaLCT software—the field calibration tool that allows integrators to correct brightness and chromaticity uniformity post-installation without hardware swaps. For control room and broadcast projects, NovaStar’s Coex series also supports dual-backup redundancy, meaning a controller failure does not take the display offline.
-
Colorlight offers a competitive alternative with strong value at the P1.8–P2.5 tier for corporate and DOOH projects.
-
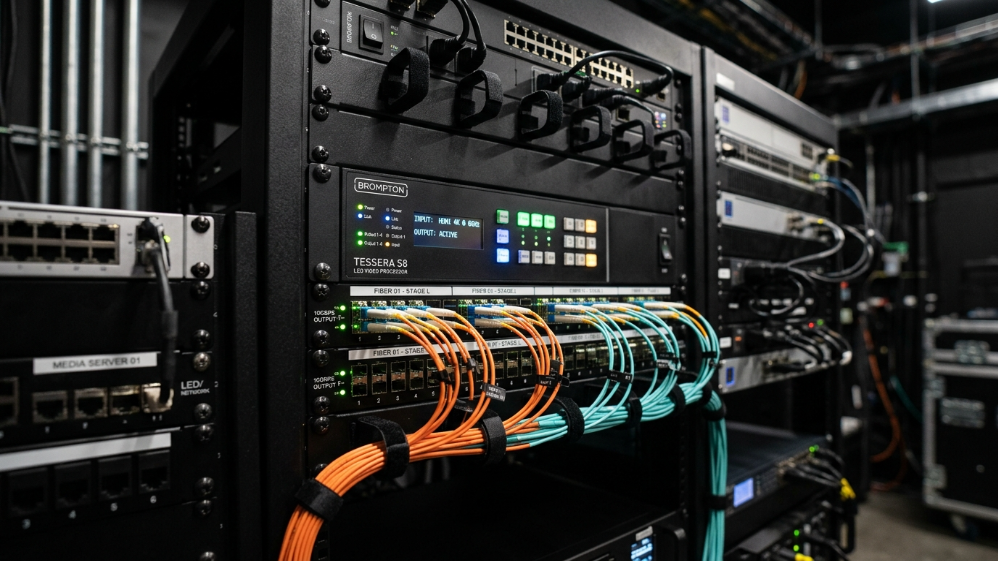
Brompton Technology is the specification of choice for virtual production and premium broadcast environments, where its Tessera SX40 processor delivers the sub-frame latency and genlock capabilities that film and live event productions require.
Do not allow the panel manufacturer to bundle an unspecified “compatible controller.” Require explicit sending card model numbers in every quote, and verify that the controller’s maximum loading capacity exceeds your planned resolution by at least 20% headroom for future content scaling.
Total Cost of Ownership: The 5-Year Budget Model
Hardware price is the number clients see. TCO is the number that determines whether the project was the right investment.
According to LED market pricing benchmarks current as of early 2026, hardware cost per square meter for indoor fine pitch LED runs approximately $900–$1,400 for P2.5 SMD, $1,400–$2,200 for P1.8 SMD/COB, and $2,500–$4,500+ for P1.2–P1.5 COB. These figures exclude signal processing, mounting structure, installation labor, and commissioning—costs that routinely add 35–60% to the hardware line in complex projects.
Over five years, power consumption creates a secondary cost differential that most project budgets ignore entirely. A P1.2 fine pitch installation running at 600 nits consumes approximately 18–22% more power per square meter than a P2.5 display covering the same area at equivalent perceived brightness. For a 30 m² control room wall operating 16 hours per day, that gap compounds into a four-figure annual energy cost difference—material enough to shift the ROI calculation when presented correctly to a client’s facilities team.
Spare module availability and field service response time are the TCO variables most frequently underweighted. Require your supplier to confirm: stock of replacement modules held in-region, committed response time for on-site service, and whether the warranty covers labor or hardware only. A three-year parts-and-labor warranty from a supplier with regional stock is worth significantly more to a 24/7 operations environment than a five-year parts-only warranty shipped from overseas.
FAQ: Fine Pitch LED Displays for B2B Integrators
Q1: What pixel pitch is best for a conference room LED video wall?
For a standard conference room with seating at 2.5–4.5 meters from the screen, P1.8–P2.0 is the optimal specification in 2026. P1.5 delivers no perceptible quality improvement at those distances but increases hardware cost by 20–30%. Reserve P1.5 and below for boardrooms with dedicated presenter positions closer than 2 meters, or rooms where the display regularly shows dense financial or technical data.
Q2: How does COB packaging affect long-term maintenance costs?
COB reduces individual component failure rates significantly—field data from high-traffic installations shows COB panels averaging roughly half the annual module replacement rate of equivalent SMD deployments. However, when COB modules do require replacement, the minimum replaceable unit is larger than an SMD chip, which increases per-incident parts cost. Net TCO over five years favors COB in 24/7 and high-traffic environments; SMD remains competitive in standard corporate deployments with controlled operating hours.
Q3: What refresh rate do I need if my LED wall will be filmed on camera?
Specify a minimum 3,840 Hz refresh rate for any camera-facing application. At this rate, the display’s scan cycle is faster than the exposure window of any camera operating at standard broadcast frame rates, eliminating the horizontal banding artifact that appears on lower-refresh panels when filmed. For virtual production volumes, Brompton Tessera-controlled panels with a refresh rate of 5,760 Hz or higher are the current industry standard.
Q4: What certifications should I require from an LED display supplier for North American and EU projects?
For North America: ETL or UL listing for the power supply chain, FCC Part 15 Class A compliance for electromagnetic emissions. For EU projects: CE marking is mandatory, with RoHS compliance confirming restricted substance compliance. For projects in healthcare or government facilities, additionally verify IEC 62368-1 audio/video equipment safety certification. Ask suppliers for test reports, not just certificate numbers—certificate numbers can be verified; claims cannot.
Q5: At what point does a finer pixel pitch stop improving perceived image quality?
Beyond a viewing distance of four times the pixel pitch in meters, the human eye can no longer resolve the incremental detail between adjacent pitch tiers. A viewer at 6 meters cannot distinguish a P1.5 from a P2.5 display under standard content. This “diminishing returns threshold” is the most powerful tool an integrator has for right-sizing specifications—and for protecting client budgets from unnecessary pitch inflation driven by supplier margin incentives.
Expert Verdict
Pixel pitch is a means to an end, not a badge of technical ambition. The installations that perform best over a five-year horizon—in image quality, operational reliability, and client satisfaction—are almost never the ones with the finest pitch. They are the ones where viewing distance, content type, packaging technology, signal chain, and service infrastructure were specified together as a system.
For the majority of B2B integration projects in 2026, P1.8 with COB or quality SMD black-face packaging, driven by a NovaStar MCTRL controller, calibrated to ΔE ≤ 1 at commissioning represents the intersection of performance and commercial sanity. Push to P1.5 when the environment genuinely demands it. Hold at P2.5 when the viewing geometry supports it. And build the TCO model before the client sees the hardware quote—not after.
The display on the wall is the last decision. Everything in this guide is the first.
References:
InfoComm/AVIXA DISCAS (Display Image Size for 2D Content in Audiovisual Systems) Standard