Two suppliers, same pixel pitch, same panel size — and a 40% gap between their quotes. If you’ve sat across a procurement table staring at that spread, you already know the uncomfortable question underneath it: which number is real?
LED Display Total Cost of Ownership is the answer buyers usually discover the hard way, eighteen months in, when the “cheaper” screen has already eaten its own discount in electricity bills and service callouts.
We’ve spent enough years on the factory floor at Sostron watching this exact scenario play out — client after client — that we stopped treating it as a mystery and started treating it as an engineering problem with a solvable answer: driving architecture, cabinet serviceability, and control-system design, in that order.
A 50m² outdoor screen priced at $1,200/m² up front can carry an all-in 10-year cost anywhere from $370,000 to well over $500,000, and the gap between those two numbers has almost nothing to do with the panel itself.
| Cost Layer | % of 5-Year TCO (Typical Outdoor Project) | Who Actually Controls It |
|---|---|---|
| Hardware & Structure | 35–45% | The purchase decision |
| Electricity | 25–35% | Driving IC architecture, brightness policy |
| Maintenance & Spare Parts | 10–20% | Cabinet design, factory QC |
| Downtime / Revenue Loss | 5–15% | Component reliability, service SLA |
Inside the Build: What the Materials and Engineering Are Actually Buying You
Before we get to formulas, it’s worth pulling back the cabinet cover, because this is where the five-year cost is actually decided.
A display cabinet isn’t just sheet metal around a circuit board — the die-cast aluminum versus stamped steel choice alone affects both weight-driven transport cost and long-term corrosion resistance in coastal or high-humidity deployments.
The driving IC family determines whether your electricity bill trends flat or climbs as ambient temperature rises through a summer.
The conformal coating applied to the PCB — or skipped, to shave a few dollars off unit cost — determines whether a monsoon season is a non-event or a warranty claim.
None of this shows up as a line item on a quote. All of it shows up on your year-two invoice.
Why project teams keep coming back to Sostron for this conversation: we’re not a trading company reselling someone else’s panel — we design and manufacture out of our own Shenzhen facility, which means when we tell a client that a common cathode driving board will cut their electricity draw by 30–40%, that number comes from our own module-level testing data, not a marketing sheet.
Every batch that leaves our line has already been through 72 hours of aging test — dead-pixel screening, brightness consistency, color uniformity — because the failures that show up in a client’s second year are, almost without exception, the ones a proper aging cycle would have caught in week one.
That’s not a claim we make lightly; it’s the reason our engineering team gets pulled into RFQs specifically to sanity-check a competitor’s numbers before a client signs.
The Real Math Behind Your Electricity Bill
Here’s a pain point every facilities manager eventually runs into: the power consumption number on the datasheet never matches the number on the utility bill, and nobody explains why.
The gap comes down to one confused variable.
Annual Electricity Cost Formula
Annual Electricity Cost = Power Density (W/m²) × Screen Area (m²) × Daily Operating Hours × 365 × Electricity Rate ($/kWh)
Suppliers quote maximum power density — full white screen, 100% brightness — because it’s the more flattering number on paper.
Real advertising or event content, run at a sane brightness policy, typically draws 30–40% of that peak figure.
As LED power-consumption guidance from industry resources like Refresh LED’s calculation breakdown and LEDScreenParts’ engineering guide both point out, peak power density belongs in your electrical infrastructure planning — breaker sizing, PDU selection, generator loads — while average power density is what you should be budgeting against annually.
Conflating the two is the single most common error we see cross an RFQ desk.
| Display Type | Typical Power Density (Avg. Use) | Annual Electricity Cost (20m², 12 hrs/day, $0.15/kWh) |
|---|---|---|
| Standard Outdoor (SMD, standard driving) | 350–450 W/m² | ~$4,600–$5,900 |
| Outdoor, Common Cathode Driving | 180–250 W/m² | ~$2,400–$3,300 |
| Fine Pitch Indoor / COB | 150–220 W/m² | ~$2,000–$2,900 |
Run this calculation before you compare quotes, not after installation goes live.
A screen priced 20% higher but built on common cathode driving frequently repays that premium in electricity savings alone within 24–36 months — and that’s before maintenance or downtime enter the conversation.
One Screen Doesn’t Fit All: Cost Profiles by Application
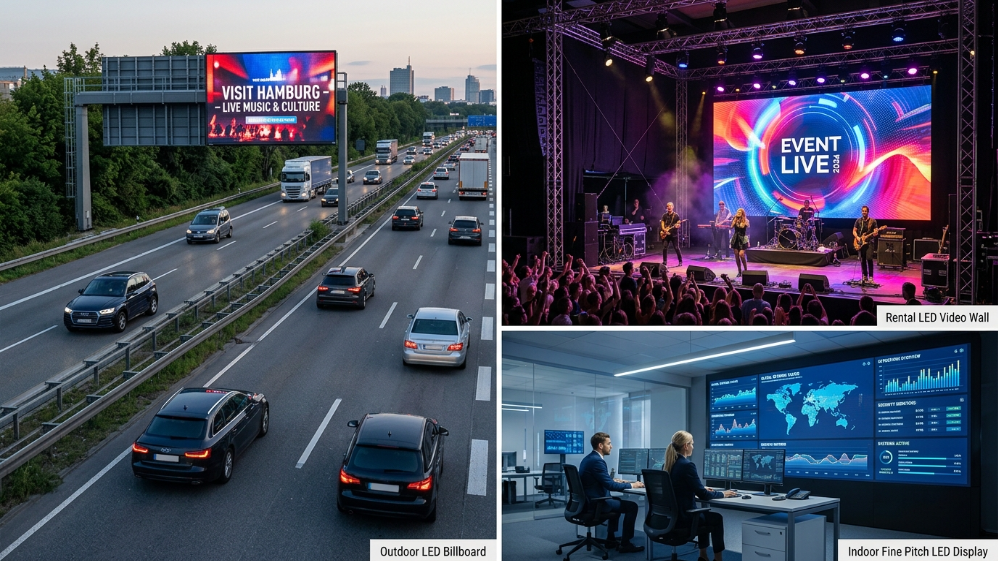
This is where most cost guides quietly fall apart — they model a single generic screen and call it done, and any buyer working a real project already knows that’s not how the math behaves.
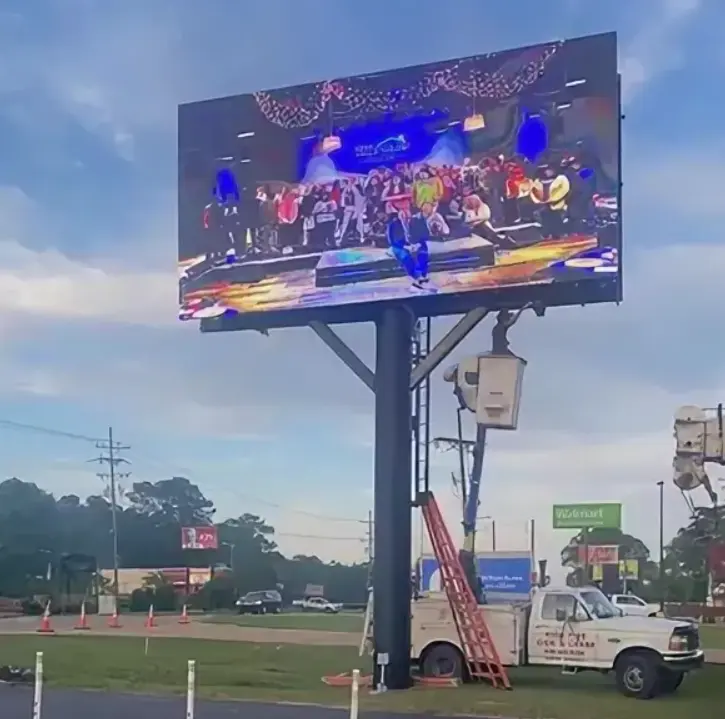
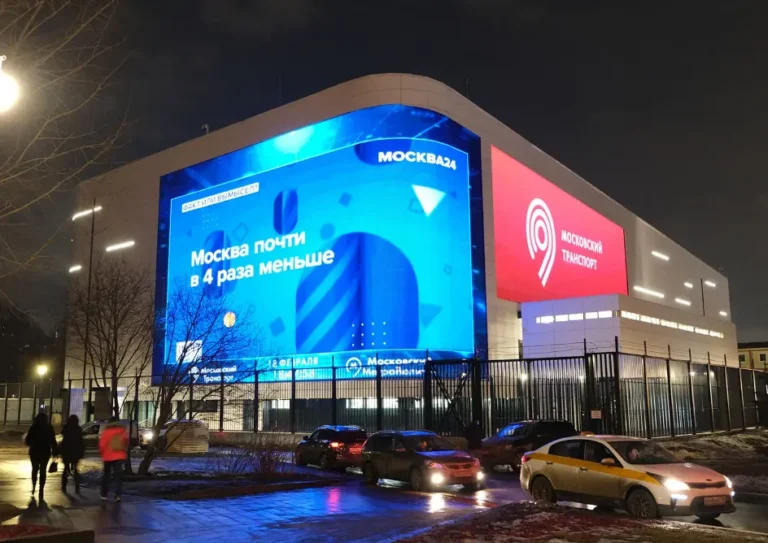
An outdoor billboard runs 10–14 hours daily under direct sun and swinging temperatures; its TCO curve is dominated by electricity draw and enclosure durability.
A rental or event screen barely logs 200 operating hours a year, but gets bolted together and torn down dozens of times across its life — its real cost driver is connector fatigue, cabinet weight, and transport damage, not kilowatt-hours.
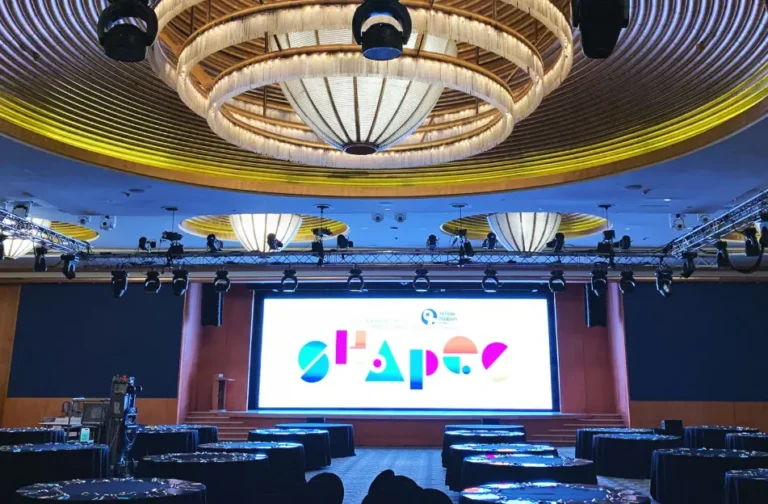
A fine-pitch indoor or COB wall for a control room runs continuously at low brightness, so calibration drift and near-viewing maintenance dominate while energy cost fades into the background.
Apply an outdoor-style cost model to a rental fleet, or the reverse, and your budget forecast will be wrong in both directions — sometimes by a wide margin.
Inside the Cabinet: Where the Maintenance Bill Is Actually Born
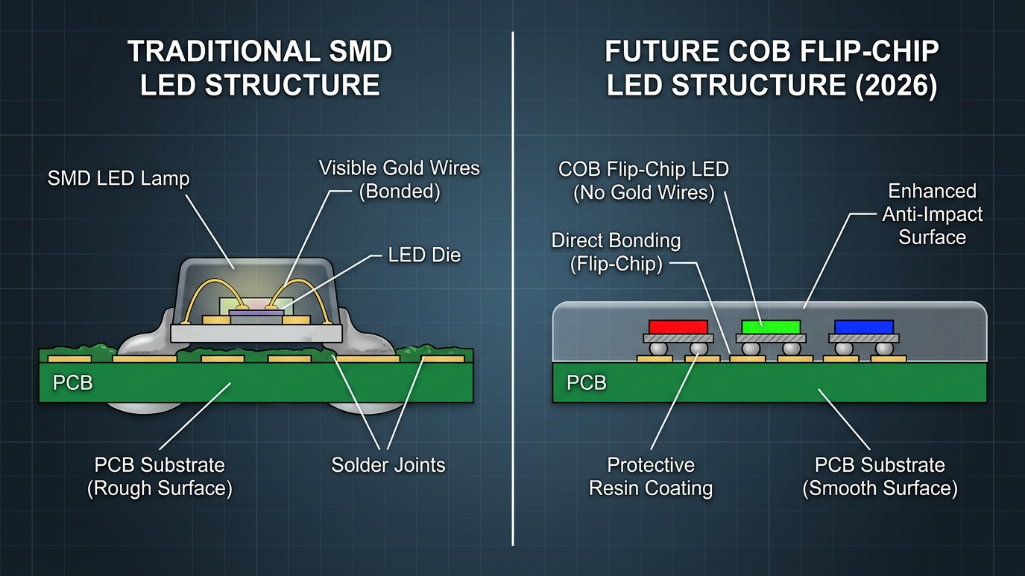
Two displays can share identical pixel pitch and brightness specs and still carry radically different five-year maintenance bills — and the reason isn’t visible from outside the cabinet.
COB (Chip on Board) packaging encapsulates the LED die directly onto the PCB under a protective resin layer, rather than exposing discrete surface-mount lamp beads the way standard SMD panels do.
The engineering difference is physical — nothing to knock loose — and the commercial payoff is measurable: COB panels hold up better against impact and moisture ingress, and keep tighter color consistency at close viewing range, which is exactly the environment a boardroom or control room puts them in.
Service Access and Long-Term Maintenance Costs
Service access matters just as much as the chip package.
A front-service cabinet lets a technician swap a failed module from the viewing side in minutes, without disturbing neighboring panels or booking a scissor lift for a rear-access wall.
Multiply that labor difference across every service call over a ten-year contract, and it becomes one of the largest — and least discussed — line items buried inside LED display total cost of ownership.
Reliability Measurement: MTBF and Redundancy Design
Reliability itself is something you can put a number to, not something you have to take on faith.
MTBF (Mean Time Between Failures) quantifies it, and it’s tied directly to pixel pitch and redundancy design — how the driving circuit is segmented so a single IC fault takes out one small zone instead of an entire module.
A cabinet with proper redundancy fails cheap; one without it fails expensive.
If a supplier can’t produce an MTBF figure backed by real aging-test data, that’s a maintenance-cost warning sign, not a paperwork gap.
The Diagnostic Visit You Never Have to Make
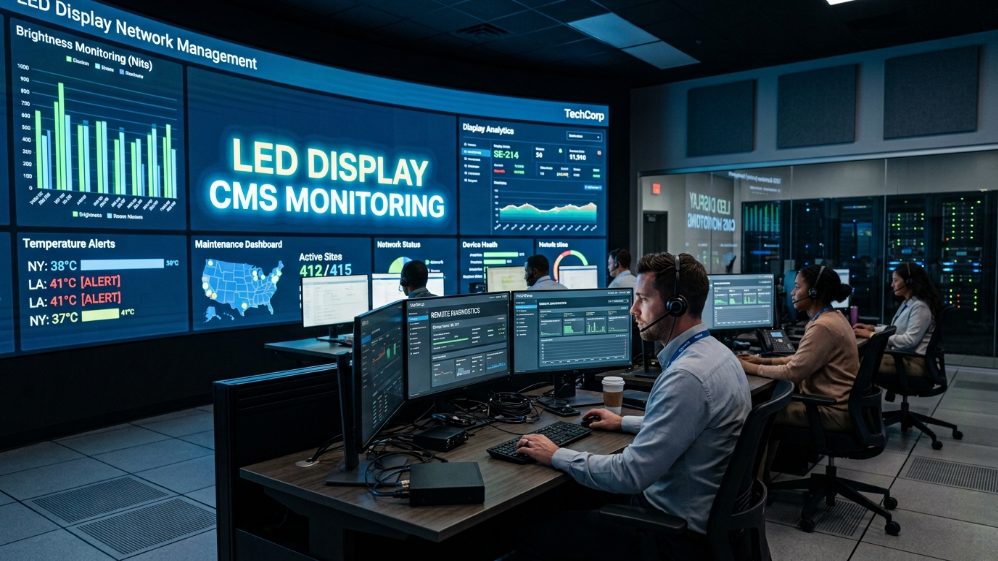
Here’s a cost almost no guide accounts for: most LED display maintenance spend isn’t repair cost at all — it’s the labor cost of finding the problem in the first place.
A technician driving out to diagnose a brightness inconsistency is already billing hours before a single component gets touched.
How CMS Reduces Hidden Maintenance Costs
A properly built CMS closes that gap before it opens.
Real-time voltage and brightness monitoring flags a failing power supply before it takes a module down with it.
Scheduled brightness curves shift automatically between daylight and night operation, trimming energy draw without anyone touching the panel.
Fleet-wide dashboards let one operator oversee dozens of screens across multiple sites instead of dispatching a crew for every routine check.
In our own deployments for DOOH clients running networks of fifteen to thirty sites, moving from reactive to remotely-diagnosed maintenance has consistently cut on-site service visits by a third to a half over the display’s operating life — and every truck roll avoided comes straight off the total cost of ownership ledger.
What an Idle Screen Really Costs You
Downtime is the layer buyers most often forget to price, mostly because it never arrives as a line-item invoice.
For a DOOH network, a screen sitting dark for 48 hours isn’t just a service ticket — it’s 48 hours of unsold ad inventory, plus whatever make-good is owed to the advertiser on that slot.
For a broadcast studio or control-room wall, unscheduled downtime carries an operational risk that’s harder to price but rarely small.
The practical move: multiply your screen’s daily revenue by your supplier’s average repair turnaround, then fold that number into every quote you compare.
A hardware price 10% higher, backed by a 24-hour spare-parts guarantee, routinely beats a cheaper quote sitting behind a two-week replacement lead time.
Not All Power Grids Are Built the Same
LED display total cost of ownership shifts meaningfully by region, and treating one global estimate as universal is a mistake we see repeated across cross-border projects more often than it should be.
| Region | Avg. Commercial Electricity Rate | Key TCO Variable | Practical Impact |
|---|---|---|---|
| North America | $0.12–$0.18/kWh | Import duties, UL certification | Higher upfront compliance cost, moderate energy cost |
| Europe | $0.20–$0.32/kWh | Energy efficiency mandates | Common cathode driving pays back faster |
| Middle East | $0.08–$0.13/kWh | Extreme heat, dust ingress | Cooling and IP-rating drive cost more than power rate |
| Africa | Variable, grid instability | Power reliability, logistics lead time | Spare-parts inventory matters more than kWh price |
A recent regional TCO breakdown from Chipshow EU makes a related point worth repeating: hardware typically represents less than half of a display’s true ten-year lifecycle cost in a European deployment once energy tariffs and compliance requirements are folded in — which is precisely why the driving-architecture decision matters more in Frankfurt than it does in Dubai.
From the Field: An Outdoor DOOH Rollout, Told in Numbers
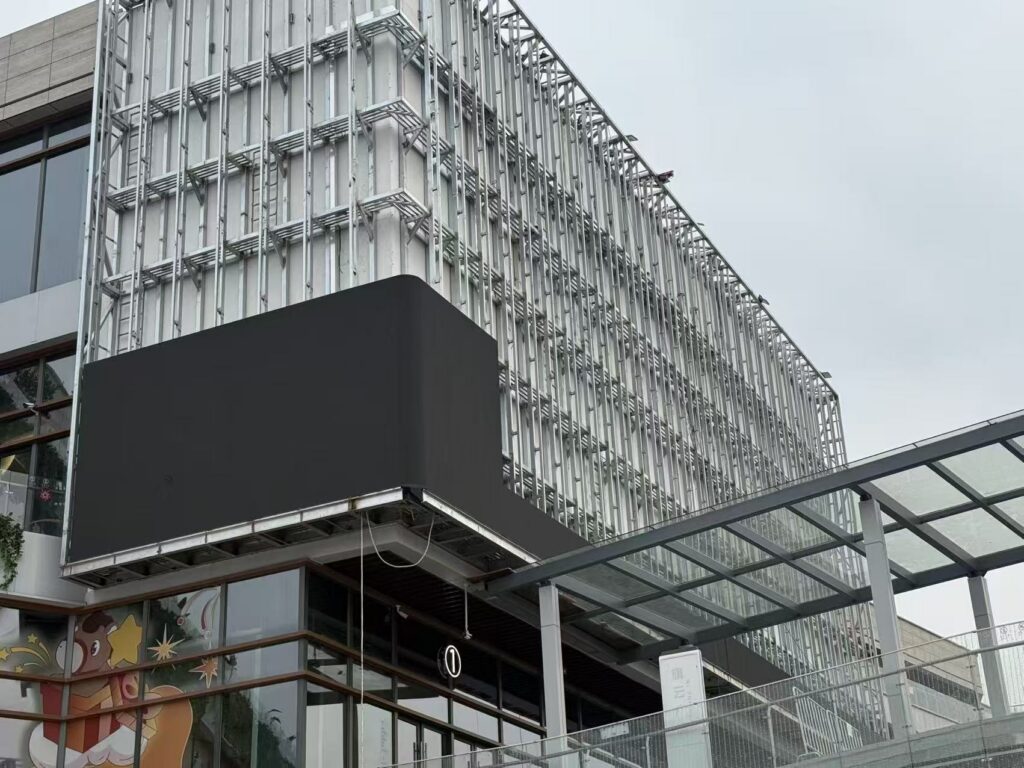
A regional DOOH operator came to us mid-2025 comparing our quote against a competitor’s screen priced roughly 18% lower on paper — same pixel pitch, similar brightness rating, a 40-panel outdoor advertising network across three sites.
The lower-priced screen used a standard driving board and a rear-service cabinet design.
Ours ran common cathode driving and front-service modules, tied into our CMS platform for remote fleet monitoring.
The operator ran both power-density figures through the formula above before deciding — not after.
Their own modeling showed the standard-driving screen would cost an estimated $14,000 more per year in electricity across the network at their operating hours and local tariff, and that the rear-service architecture would likely double the average repair visit duration based on their prior fleet’s service logs.
They went with the higher-quoted option.
Eight months into operation, their maintenance team reports service calls have come in below their own projection, largely because the CMS dashboard is catching brightness drift and flagging modules before a customer-facing screen ever shows a visible defect.
It’s the kind of outcome that never shows up on an initial quote comparison, and it’s exactly the outcome the TCO math predicted.
Three Displays, One Decade: A Cost Comparison
Numbers make this concrete.
The following models a 30m² outdoor advertising screen, 12 hours/day operation, $0.15/kWh:
| Cost Item | Budget Tier | Mid-Range | Premium (Common Cathode + Aging-Tested QC) |
|---|---|---|---|
| Hardware Cost | $27,000 | $34,500 | $42,000 |
| 5-Yr Electricity | $10,600 | $7,200 | $5,100 |
| 5-Yr Maintenance | $9,000 | $4,500 | $2,200 |
| Est. Downtime Loss | $6,000 | $2,000 | $500 |
| 5-Year Total | $52,600 | $48,200 | $49,800 |
The mid-range tier edges out the premium option on raw five-year total — but its maintenance curve is still climbing as components age past their rated duty cycles, while the premium tier’s curve is already flattening.
Extend this same model to year eight or ten and the premium display overtakes mid-range on total cost in nearly every case we’ve modeled, before even factoring in the near-zero downtime risk that matters most for revenue-critical installations.
Quick Answers for Procurement Teams
What does total cost of ownership mean for an LED display?
It’s the sum of every cost tied to the screen across its operating life — hardware, installation, electricity, maintenance, spare parts, and downtime — not just the number on the purchase invoice.
How much does it cost to maintain an LED display per year?
A well-specified display typically runs 3–8% of hardware cost annually in maintenance; lower-tier builds with weak service access or thin QC frequently run 10–15%+.
Is COB or SMD better for lowering long-term LED display costs?
COB generally holds up better against impact and moisture and keeps tighter color consistency at close range, which lowers maintenance frequency specifically for indoor and control-room use.
How long does a commercial LED display actually last?
Most quality commercial displays are rated for 80,000–100,000 hours to half-brightness, though real-world lifespan depends far more on thermal management and driving architecture than on the diode rating alone.
Does a smart CMS actually reduce LED display running costs?
Yes — mainly by cutting diagnostic labor and enabling automated brightness scheduling, which lowers both energy draw and the number of on-site service visits needed over the display’s life.
The Sostron Difference
Stop comparing quotes by the square meter and start comparing them by the five-year column — that’s the whole argument of this article, distilled.
We’ve built our business on the belief that a fair quote should survive that scrutiny, which is why every screen leaving our Shenzhen facility carries real aging-test data, a driving architecture chosen for operating cost rather than headline price, and a CMS platform designed to catch problems before they become invoices.
If a supplier can’t hand you power density at actual operating brightness, an MTBF figure backed by testing, and a spare-parts SLA in writing, you’re not looking at a real cost — you’re looking at a placeholder that gets corrected at your expense, twelve months in.
If your project falls into the high-brightness, high-duty-cycle category this article keeps circling back to, our outdoor LED display range engineered specifically around common cathode driving is worth a look before you finalize a quote.
And if fleet uptime and remote diagnostics matter more to your operation than any single panel spec, our CMS and power-consumption planning resources walk through exactly how we model total cost of ownership before a project ever reaches production.
Price Note: LED Display Total Cost of Ownership Consideration
The price of an LED display is not determined only by the initial purchase cost. Factors such as pixel pitch, screen size, brightness requirements, driving technology, cabinet structure, installation environment, energy efficiency, maintenance design, and after-sales support can significantly influence the final investment.
The prices mentioned in this article are based on typical commercial LED display project scenarios and industry estimation models. Actual project costs may vary depending on specifications, application requirements, regional standards, shipping conditions, installation complexity, and customization needs.
For an accurate quotation, buyers should evaluate the total cost of ownership (TCO) instead of comparing only the upfront price per square meter. A higher-quality LED display with lower power consumption, better reliability, easier maintenance, and longer service life may provide better long-term value and reduce operational expenses over the entire product lifecycle.
References:
LED Lighting Facts: Understanding LED Energy Efficiency and Lifetime
Life-Cycle Cost Analysis of LED Technologies