Stop guessing amps. Get circuit-ready numbers before you quote, spec, or sign a venue contract.
Quick-Reference: LED Video Wall Power Consumption by Application Type
Before you run a single calculation, you need to know what ballpark you’re operating in. Based on our engineering team’s experience across hundreds of fixed-install and live-event deployments, here are the power density benchmarks that actually hold up in the field:
| Application Type | Pixel Pitch Range | Avg. Power Density (W/m²) | Peak Power Density (W/m²) | Typical Average Load Factor |
| Indoor Corporate/Conference | P1.5–P2.5 | 180–280 | 400–600 | 30%–40% |
| Indoor Rental & Live Events | P2.6–P3.9 | 220–320 | 500–700 | 35%–50% |
| DOOH Retail/Semi-Outdoor | P2.5–P4 | 280–400 | 600–800 | 40%–55% |
| Outdoor Advertising/Billboard | P6–P10 | 350–500 | 800–1,200 | 45%–60% |
| Broadcast Studio (Fine Pitch) | P1.2–P1.9 | 200–350 | 500–750 | 25%–35% |
Note: Average load factor reflects real-world content mixes (video, graphics, partial-white frames). Use peak density for PDU and circuit sizing. Use average for electricity cost and TCO projections.
These numbers matter immediately—before you’ve even spoken to a supplier. A system integrator quoting a 40m² outdoor DOOH installation who uses peak power figures for electricity cost estimates will hand their client an operating cost projection that is 2× to 3× higher than reality. Conversely, an event planner who uses average consumption figures to size circuits will be on the phone with an emergency generator company at 8 PM on show night.
Both scenarios are avoidable. This guide gives you the complete framework to get it right the first time.
Why Power Estimates Go Wrong—And What It Costs When They Do
Let’s be direct: most LED video wall power calculations fail not because engineers are careless, but because the industry’s standard documentation actively invites the wrong interpretation.
Manufacturer datasheets list maximum power consumption—the figure drawn at 100% brightness, displaying a full-white static image with all RGB sub-pixels firing at peak current. That number is an engineering ceiling, not an operational reality. In practice, LED video walls running broadcast content, motion graphics, or mixed advertising playlists operate at 30% to 50% of that maximum. The gap between the two figures isn’t trivial. For a 20m² indoor rental wall rated at 600W/m² peak, the difference between peak and average power is 7,200W—the equivalent of five dedicated 20A circuits you may be paying to provision unnecessarily.
The consequences of getting this wrong run in both directions. Over-specify, and you’re inflating project costs, losing bids to competitors who understand real-world load profiles. Under-specify, and you’re facing tripped breakers, on-site rewiring, and the kind of production failure that ends long-term client relationships. Based on our experience with live event deployments, the single most common cause of on-site power failure is not faulty equipment—it’s a planning team that pulled the max-power figure from a spec sheet and assumed it reflected average draw.
There’s a secondary failure mode that’s equally damaging for DOOH operators and permanent installations: ignoring the power factor (PF) of the AC supply circuit. LED power supplies are not purely resistive loads. They draw reactive current, which means the apparent power (VA) your electrical system must supply is meaningfully higher than the real power (W) delivered to the panels. A system delivering 10kW of real power to LED modules with a power factor of 0.85 requires your upstream circuit to source approximately 11.76kVA. For large-scale installations with hundreds of panels, this discrepancy directly determines whether your electrical infrastructure is correctly specified—or a liability waiting to materialize.
The LED Video Wall Power Consumption Formula—Explained for AV Professionals
The Core Calculation: 5 Variables, One Framework
The fundamental power calculation for any LED video wall configuration reduces to this:
Total Panel Power (W) = Screen Area (m²) × Power Density (W/m²) × Average Load Factor
And for electricity cost projection:
Annual Energy Cost = [Screen Area × Power Density × Load Factor] ÷ 1,000 × Daily Operating Hours × 365 × Electricity Rate ($/kWh)
Every variable in those two formulas has a correct and an incorrect source. Here’s how to populate each one:
| Variable | What It Represents | Correct Source | Common Mistake |
| Screen Area (m²) | Width × Height of the full display | Physical layout drawing | Using nominal cabinet count without accounting for gaps or bezels |
| Power Density (W/m²) | Manufacturer’s rated power per square meter | Datasheet—average figure, not max | Pulling peak/max figure from spec sheet |
| Average Load Factor | Fraction of peak power in real operation | Content type analysis; typically 30–50% | Defaulting to 100% (peak) for all calculations |
| Daily Operating Hours | Hours per day the wall is active | Client operational brief | Assuming 24/7 for daytime-only installations |
| Electricity Rate | Cost per kWh at the install location | Utility bill or client facilities manager | Using a generic national average that may be 40–60% off actual rate |
How Pixel Pitch Drives Power Density—And Why This Matters for Vendor Selection
Pixel pitch is the distance in millimeters between the centers of adjacent LED clusters. Smaller pitch means more LEDs packed into each square meter—and more LEDs means more power drawn per unit area. This relationship is linear at the component level, though efficiency improvements in driver ICs and power supply design partially offset it at the system level.
According to field measurement data from large-scale commercial deployments, the power density variation between a P1.5 fine-pitch display and a P4 general-purpose panel running identical content at identical brightness can exceed 180W/m². For a 30m² installation, that’s a difference of 5,400W in continuous draw—translating to over $2,300 per year in additional electricity costs at a typical commercial rate of $0.12/kWh running 12 hours daily.
This is why pixel pitch selection is never purely a resolution decision. It’s a five-year operating cost decision. Specifying a P1.5 panel where a P2.5 would satisfy the minimum viewing distance requirement doesn’t just increase the capital cost of the project—it locks the buyer into a meaningfully higher energy spend for the life of the installation. The professional recommendation: always select the coarsest pixel pitch that satisfies the viewing distance requirement of the specific venue. Finer pitch delivers no perceptible quality improvement to an audience seated beyond the optimal viewing threshold, and it costs more in watts, dollars, and heat management complexity.
One critical nuance that separates experienced integrators from those who’ve had expensive surprises: same pixel pitch does not mean same power consumption across manufacturers. Driver IC efficiency, power supply design quality, and PWM dimming implementation can produce power density variations of 100–200W/m² between two P3.9 panels from different suppliers, even at identical brightness settings. Always request actual measured power data—not spec sheet maximums—when comparing vendor proposals.
How Content Type Changes Your Real Power Draw by Up to 40%
This is the variable that most planning guides ignore, and it’s the one that DOOH operators and broadcast studios care about most.
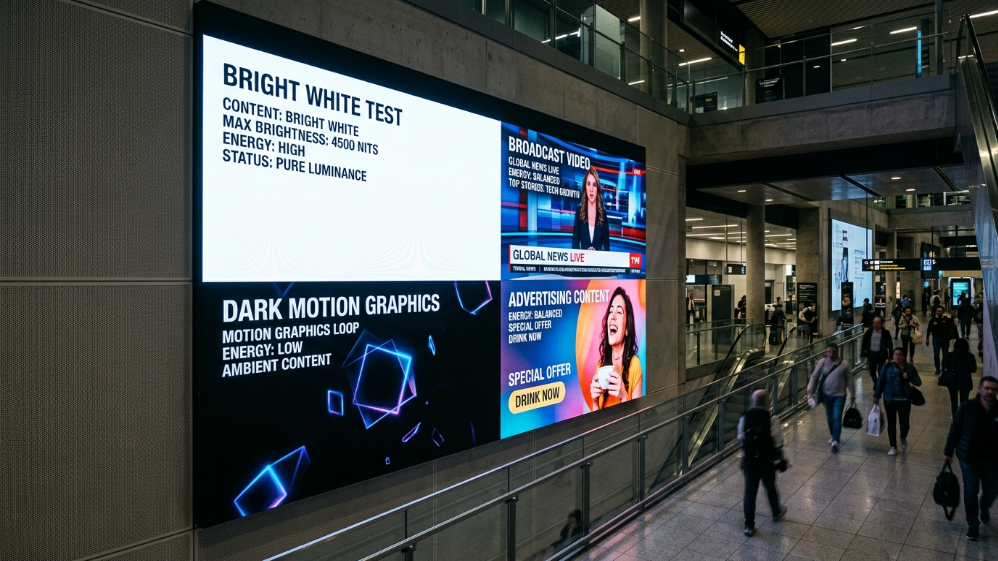
An LED display’s power consumption scales directly with how many sub-pixels are active and at what current. A full-white static image—all red, green, and blue channels at maximum—is the worst-case scenario. Motion graphics with black backgrounds, color-graded video, and standard broadcast content all draw significantly less. The practical ranges, based on content category:
-
Full white/logo-heavy static graphics at 100% brightness: ~85–95% of peak power
-
Standard broadcast video content (mixed scenes): ~40–60% of peak power
-
Dark-background motion graphics (common in events/concerts): ~25–40% of peak power
-
Advertising playlists with mixed creative (typical DOOH): ~35–55% of peak power
For a DOOH operator running a 50m² outdoor display at a power density of 450W/m² peak, the difference between a bright-background advertising loop and a dark-creative campaign is approximately 4,500W in continuous draw. Over a year of 14-hour daily operation, that’s a gap of nearly 23,000 kWh—translating to $2,760 in electricity costs at $0.12/kWh.
This is not an abstract engineering consideration. It’s a concrete input into content strategy. Brands and media buyers that understand this relationship can architect their creative briefs to reduce operating costs without any compromise to audience impact. For operators managing large outdoor networks, the cumulative effect of content-aware power planning across a portfolio of screens can represent tens of thousands of dollars in annual savings.
[Article continues—Part 2 covers the interactive calculator walkthrough, use-case-specific planning guides for system integrators, event companies, and DOOH operators, plus the full FAQ section.]
Power Planning by Role: What System Integrators, Event Companies, and DOOH Operators Actually Need to Calculate
The industry’s generic “watts per square meter” conversation collapses the moment you try to apply it to a real project brief. The variables that matter—and the mistakes that cost money—are different for each buyer profile. Here’s the role-specific framework that our engineering team uses across project types.
For System Integrators: Circuit Load and NEC-Compliant Sizing for Permanent Installations
Fixed installations carry the highest consequence for power miscalculation. Unlike a rental event where you can add a generator, a permanent install is built into the venue’s electrical infrastructure. Getting it wrong means change orders, structural rework, and a client relationship that rarely recovers.
The professional workflow runs in this sequence:
-
Step 1—Establish peak panel load. Multiply total screen area by the manufacturer’s maximum power density. This is your worst-case draw—the number your PDU and circuit breakers must handle.
-
Step 2—Apply NEC derating. Under National Electrical Code Article 210.20, continuous loads (defined as loads expected to run for 3+ hours) must not exceed 80% of the branch circuit rating. A 20A circuit can serve a maximum of 16A of continuous LED load. Skipping this step is how permanent installations develop chronic tripping problems six months post-handover.
-
Step 3—Add peripheral overhead. LED panels are not the only power draw in the system. Add 15–20% overhead for video processors, sender cards, fiber converters, and cooling equipment. A wall that draws 8,400W at peak from its panels alone will pull closer to 9,800–10,080W from the electrical panel when the full signal chain is live.
-
Step 4—Design PDU distribution. Group panels into circuits that respect the derated amperage limits, and ensure each PDU is labeled with its maximum continuous load. Production-grade installations document this circuit-by-circuit—it protects the integrator and gives the venue’s facilities team a clear service reference.
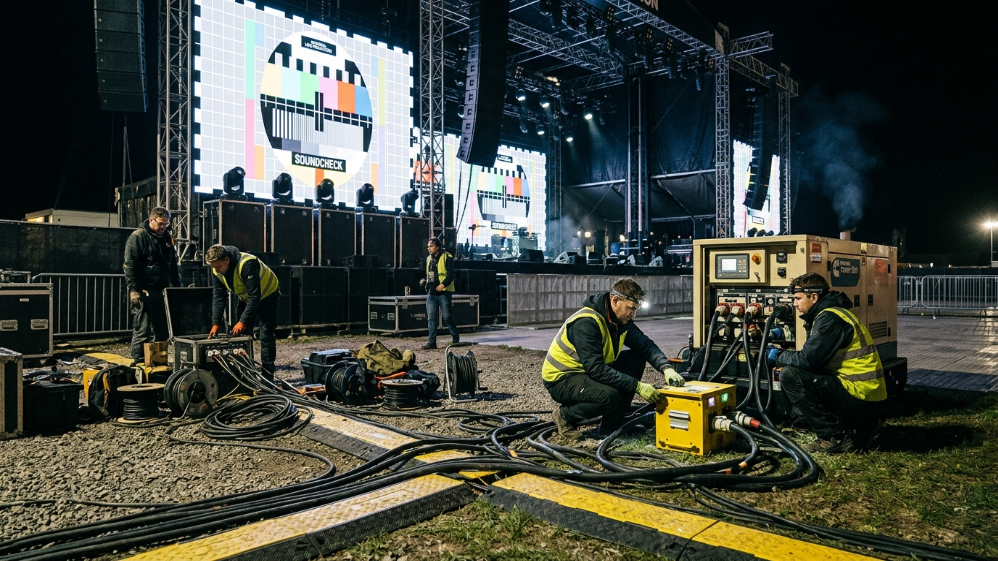
For Event Planners: Generator Sizing for Temporary Deployments
Temporary deployments have a different failure mode: you are often working with venue power that was not designed for LED loads, or you are generating your own power on-site. Both scenarios require a clean calculation before load-in day.
The generator sizing formula adds one critical multiplier to the base power calculation:
Generator Capacity Required (kVA) = (Total Panel Peak Load + 20% Peripheral Overhead) ÷ Power Factor (typically 0.85) × 1.25 safety margin
The 1.25 safety margin accounts for generator efficiency losses and inrush current at startup—the momentary surge when panels initialize that can be 3–5× the steady-state draw. Undersizing by even 10–15% against peak demand is enough to cause voltage sag, which manifests on screen as brightness flickering and color drift before the generator cuts out entirely.
For multi-wall configurations common in concert and festival settings, calculate each wall’s peak load independently, then sum them. Do not assume that panels running at different brightness levels will average out your total demand—electrical infrastructure must be sized for simultaneous peak draw across all circuits.
For DOOH Advertisers: Building a 5-Year TCO That Holds Up in a Board Presentation
This is where the conversation shifts from engineering to finance—and where the choice of LED supplier has compounding consequences that extend well beyond the purchase order.
According to independent energy analysis of large-format outdoor LED deployments, electricity costs over a 3-to-5-year operational window routinely exceed the original hardware investment for high-brightness outdoor configurations running 14+ hours daily. The capital cost is a one-time event. The energy draw is every day for five years.
The TCO framework that survives board-level scrutiny requires four inputs:
| TCO Input | Data Source | Common Estimation Error |
| Annual kWh consumption | Screen area × avg. power density × load factor × hours/day × 365 ÷ 1,000 | Using peak density instead of average |
| Electricity rate trajectory | Utility contract + 3–5% annual escalation assumption | Using today’s flat rate for all 5 years |
| Brightness degradation factor | Manufacturer’s L70 lifespan data | Ignoring that aging panels often need higher drive current to maintain brightness, increasing draw |
| Cooling system overhead | HVAC load increase from ambient heat rejection | Almost universally omitted in supplier proposals |
The brightness degradation factor deserves specific attention. LED panels dim over time—typically reaching L70 (70% of original brightness) after 50,000–100,000 operating hours. To compensate, operators often increase drive current, which increases power consumption. A TCO model that doesn’t account for this understates 5-year energy costs by 8–15% for high-utilization outdoor installations.
5 Proven Strategies to Reduce Power Consumption Without Sacrificing Display Performance
Efficiency optimization is not about dimming your screens into irrelevance. The following strategies deliver measurable savings while preserving the visual impact your content requires.
-
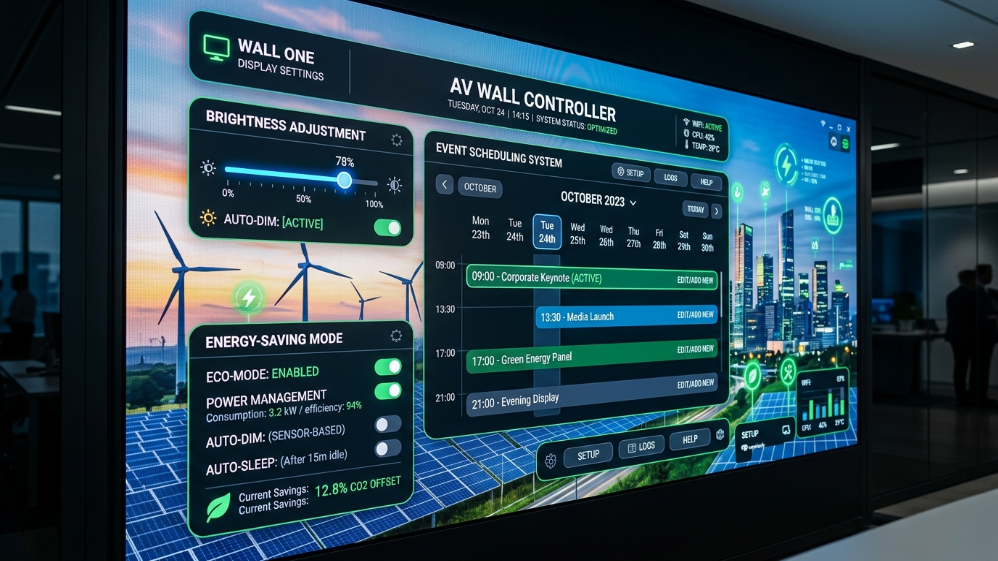
Implement scheduled PWM dimming. PWM (Pulse Width Modulation) dimming controls brightness by varying the duty cycle of the LED drive current. Dropping brightness from 100% to 70% during daylight hours and 40% after dusk can reduce total energy consumption by 35–50% annually—without any perceptible quality loss to the audience at those ambient light levels. Most modern LED controllers support automated schedules; this is a configuration decision, not a hardware upgrade.
-
Design content for dark backgrounds. As established above, content with predominantly dark backgrounds draws 40–60% less power than full-white creative. For DOOH operators, building this into the content brief from the outset costs nothing and saves significantly.
-
Match pixel pitch to actual viewing distance. Specifying a P1.5 panel for a venue where the nearest viewer sits 8 meters away delivers no additional visual quality—and adds roughly 100–180W/m² to your continuous power draw compared to a P2.5 or P3.9 that would be visually indistinguishable at that distance.
-
Prioritize energy-efficient driver ICs when comparing vendor proposals. Not all LED panels are equal at the component level. Suppliers using high-efficiency constant-current driver ICs and 80%+ efficient switching power supplies can deliver panels that consume 20–30% less power at identical brightness and pixel pitch compared to budget alternatives. Request power measurement data under standardized test conditions—not spec sheet maximums.
-
Account for heat dissipation in the total energy budget. Every watt of power consumed by an LED panel is ultimately rejected as heat into the installation environment. For indoor permanent installations, this directly increases HVAC load. An 8kW LED wall in a conference room effectively adds 8kW of continuous heating load to the space’s cooling system. Factoring this into your building’s energy model prevents surprises in the facility’s operating costs post-installation.
Frequently Asked Questions
How many watts does an LED video wall use per square meter?
Indoor LED video walls typically draw 180–320W/m² average under real operating conditions, with peaks of 400–700W/m² at full brightness. Outdoor displays run higher: 350–500W/m² average, up to 1,200W/m² peak for large-pitch high-brightness panels. Always request both figures from your supplier—the gap between them defines your planning range.
What size generator do I need for a temporary LED video wall event?
Calculate peak panel load (screen area × max power density), add 20% for processors and peripherals, divide by your generator’s power factor (0.85 is standard), then apply a 1.25 inrush safety multiplier. A 20m² rental wall at 600W/m² peak requires roughly: (12,000W × 1.20) ÷ 0.85 × 1.25 = approximately 21.2kVA. Round up to the next standard generator size; never run at nameplate capacity.
Why does my LED panel spec sheet show a different wattage than what my electrician is measuring on-site?
Spec sheets list maximum power—full white image, 100% brightness, all sub-pixels at peak current. Real-world content draws 30–60% of that figure. Your electrician’s clamp meter is reading actual power, which is correct for operational purposes. Use spec sheet maximum for circuit protection sizing; use measured or calculated average for energy cost projections.
How do I calculate the number of PDUs needed for an LED video wall installation?
Divide total peak panel load by the derated capacity of each PDU circuit (PDU amperage × voltage × 0.80 for NEC continuous load compliance). For a 15kW peak wall on 120V circuits with 20A PDU outlets: each outlet supports 120V × 20A × 0.80 = 1,920W. You need at minimum 8 outlets—specify 10–12 for headroom and peripheral loads.
Is an LED video wall more energy-efficient than an LCD video wall at the same screen size?
For screen areas above roughly 6–8m², direct-view LED is consistently more efficient than LCD video wall arrays. LCD systems require individual backlight modules for each panel tile, and the aggregate backlight power across a large tiled configuration typically exceeds the equivalent LED installation’s draw. At smaller screen sizes the comparison is closer, but the maintenance cost differential—LED panels have no backlights to replace—is a separate TCO advantage that compounds over time.
Expert Verdict
Power consumption planning is the risk management layer that separates a professional LED video wall deployment from an expensive improvisation. The calculation itself is not complex—it’s five variables and two formulas. What’s complex is knowing which numbers to use for each variable, and why the wrong choice in either direction costs real money.
Use peak power density for PDU selection, circuit protection, and generator sizing—always with NEC derating applied. Use average power consumption (peak × load factor, typically 0.35–0.50) for electricity cost projections and TCO models. Never use one figure where the other belongs.
For permanent installations, validate your power calculations against actual measured draw during commissioning, before the venue’s facilities team signs off. For DOOH operators, build a five-year energy model that accounts for brightness degradation and local electricity rate escalation—the numbers that look manageable at year one rarely look the same at year four.
The integrators and operators who get this right don’t just avoid failures. They win more bids, because they can show clients a credible TCO model that competitors built on guesswork.
B2B Procurement Note: When structuring your project budget, remember that hardware procurement accounts for only a portion of the Total Cost of Ownership (TCO). Long-term operational electricity expenses and infrastructure preparation costs vary wildly based on configuration and vendor efficiencies. To benchmark your localized utility expenses, multi-year operating budgets, and technical specification pricing templates, consult our detailed commercial pricing and layout advisory frameworks.
References:
IEEE Standards for Power Electronics & Display Systems
ENERGY STAR Program for Displays and Commercial Electronics